Wednesday, October 27, 2010

Social Network Analysis of May 09 & November 09 Conference

I have created another set of maps for the social network analysis of Tutor/Mentor Connection leadership and networking conferences organized in May 09 and November 09. These conferences are conducted every year for the improvement of quality and availability of tutor/mentor programs in the high poverty areas of Chicago. The SNA maps for May 09 and Nov 09 conferences will show the growth in the network of Tutor/Mentor Connection (T/MC) with participation of new organizations every year, geographical distribution of conference attendees, and strength of the relationship between T/MC and other organizations. These maps will also provide insight regarding the number of tutor/mentor programs, schools, universities, media, speakers, non-speakers and donors attending these conferences in May09 and Nov 09. (Click on the maps for enlarged view)


                                                          May 09 Conference
                                                                     
The above map shows the organizations that attended the May 09 T/MC conference. This conference drew 85 organizations and 130 attendees from Chicago and other regions. The organizations that are closer to T/MC on the basis of zip code are in a darker shade of red, but as we move further away from T/MC the shades become lighter and lighter. The donor is highlighted in yellow in the map. Karina Ayala-Bermejo, Executive Director, Sun Times Judge Marovitz, Lawyers Lend-A-Hand to Youth Program, was the donor for May 09 conference.. Again, the thickness of the connecting links between T/MC and other organizations is directly related to the number of conferences the organization has attended. The organization that has attended maximum number of conferences since May 08 to May 09 has the thickest connection link to T/MC.


                                                              Nov 09 Conference

Similarly, this map shows the organizations that attended the Nov 09 T/MC conference. This conference drew 90 organizations and 150 attendees from Chicago and other regions. T/MC received funds from the same donor (Lawyers Lend-A-Hand to Youth Program) in Nov 09 conference also and the donor is highlighted in yellow in the map. As the thickness of the links is directly proportional to the conference attended, the organization that has attended maximum number of conferences from May 08 to Nov 09 has the thickest connection link to T/MC.
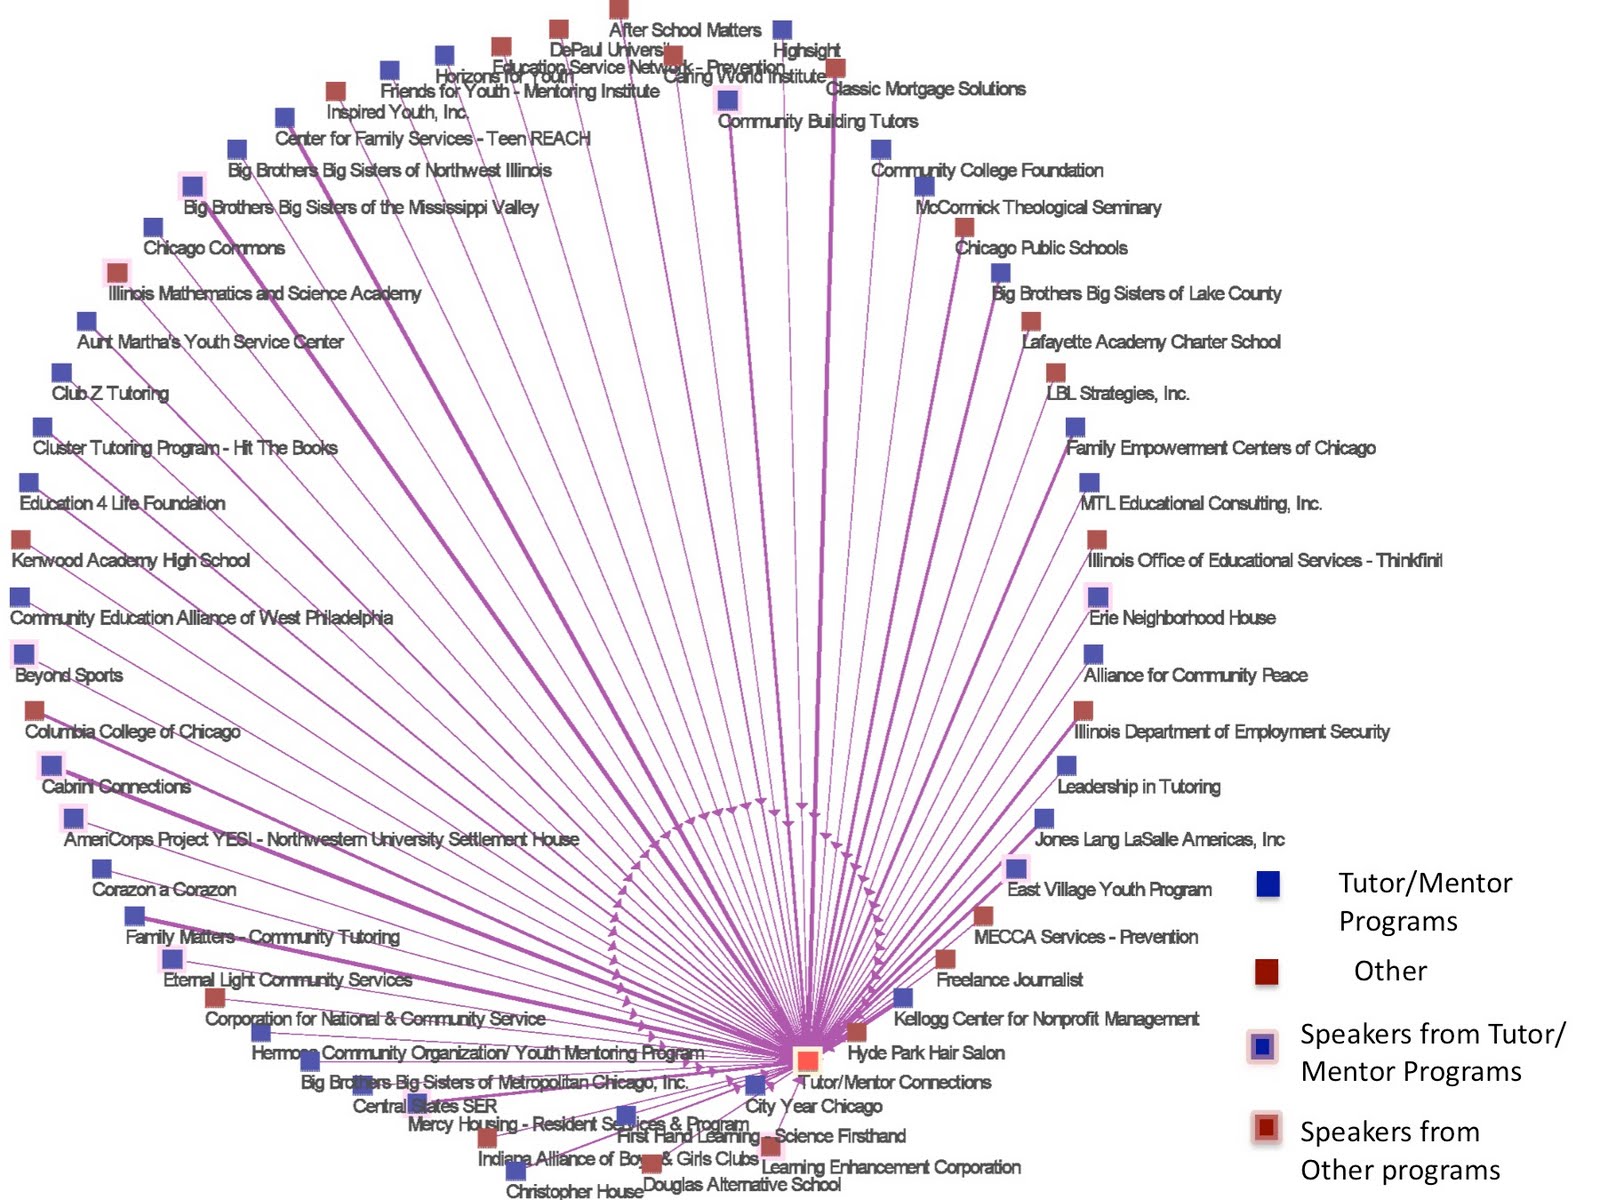

                                                   Speakers May 09

                                                 Speakers Nov 09

In the above two maps we have shown the number of speakers and non-speakers that participated in May 09 and Nov 09 conference. The speakers are shown in dark blue and non-speakers are in light blue. In May 09 conferences there were about 60 speakers from different regional and local organizations, where as in Nov 09 conference there were approximately 35 speakers.


                                            Programs May 09


                                             Programs Nov 09


The above two maps represents a nice distribution of organizations that attended the May 09 and Nov 09 conferences based on different programs. The map has been color-coded to represent tutor/mentor programs, programs supporting tutor/mentor programs, donors, schools, universities, literacy and media.


The above map shows a combination of May 09 and Nov 09 conference. In this map the organizations are divided into three categories: 1) attended May 09 conference 2) attended Nov 09 conference and 3) attended both May 09 & Nov 09 conference. 


                                    Interactive map


                                        SNA map


Finally I have used an interactive map of T/MC program locator and a SNA map to show the number of tutor/mentor programs present in different poverty regions of Chicago based on the 2000 Census data for % living in poverty in Chicago, IL. The interactive map shows the number of tutor/mentor programs present within different areas of Chicago based on their zip codes, and those areas are color-coded based on the percentage of poverty in that area.
The SNA map shows the conference attendees from different tutor/mentor programs for the May09 and Nov 09 conference. The tutor/mentor programs are color-coded on the basis of the poverty in that zip code. The map shows that attendees in the May09 and Nov 09 are from wide spectrum of poverty regions. These conferences help participants from high poverty zip codes to learn from each other, and build relationships that help them constantly improve their own programs. As people from different zip codes come to these conferences, they can borrow ideas from these conferences and implement it in their own respective zip codes.

Monday, October 4, 2010

Analysis of November 08 Conference

As discussed in my previous blog, Tutor/Mentor Connection (T/MC) organizes leadership and networking conferences in May and November every year to share resources and information with organizations involved in tutor/mentor programs and organizations supporting these programs. The main aim of the conferences is to improve the quality of tutor/mentor programs in the poor neighborhoods.
I am trying to map all the conferences starting from May 2008 till the most recent conference i.e May 2010, using social network analysis software to visualize and understand the strength of relationship between T/MC and different organizations attending these conferences each year. As we start mapping all the conferences one by one, we can get an idea about the growth of the T/MC network with participation of new organizations every year, geographical distribution of conference attendees, and strength of the relationship between T/MC and other organizations.
In my previous blog, I had presented an analysis of the May 08 T/MC conference, showing the geographical distribution (local organizations & regional organizations) of organizations attending the conference, the number of tutor/mentor programs and other programs, and the number of speakers and donors for local and regional areas. I have created another set of maps in order to analyze the Nov 08 conference and to compare the May 08 and Nov 08 conferences.


The above map shows a geographical distribution of organizations that attended the Nov 08 conference. As per the map, 95 organizations were present at the conference and these organizations are divided into local and regional organizations. The thickness of the links represents the strength of the relationship between T/MC and those organizations. The strength is directly related to the number of conferences the organization has attended, i.e., organizations that have attended both the May and Nov 08 conferences are given higher link strength than the others. Karina Ayala-Bermejo, Executive Director, Sun Times Judge Marovitz, Lawyers Lend-A-Hand to Youth Program, was the donor for Nov 08 conference. The donor is highlighted in green in the map. (Click on the map above for enlarged view)
The organizations are arranged radially as a function of their distance from T/MC.


Here is another map showing the relative spatial distribution of organizations attending the Nov 08 conference based on their physical proximity to T/MC (on the basis of zipcodes). In this map the organizations that are closer to T/MC on the basis of zipcode are in a darker shade of red, but as we move further away from T/MC the shades become lighter and lighter. Thus, the organizations that are outside Illinois are in white. Another interesting thing about this map is that it arranges the organizations on the basis of centrality. Centrality is considered as a crucial characteristic for network analysis, as it indicates which nodes are more central and which are more peripheral. In this map, the organizations are placed in circular rings on the basis of their degree of closeness to T/MC. The organizations on the ring closest to T/MC have the highest weight and the organizations present on the last ring, which is shown in dotted lines, has the least weight. We have arranged the organizations in the rings based on their distance from T/MC. The following scales are used for the rings:

Distance from T/MC         Weight
  • 0-5 miles                       6
  • 5-10 miles                     5
  • 10-25 miles                   4
  • 25-50 miles                   3
  • Above 50 miles             2
  • Out of state                  1
(Click on the map above for enlarged view)


This map shows the distribution of tutor/mentor programs and programs that support the tutor/mentor programs (represented as “other” in the map) on the basis of their physical proximity to T/MC (centrality layout as discussed above). Here it can be interpreted that majority of tutor/mentor programs that attended the Nov 08 Conf. are within 5 miles or 5-10 miles from T/MC. The map shows that there is almost an equal participation of tutor/mentor programs and non-tutor/mentor programs in the Nov 08 Conference. (Click on the map above for enlarged view)


The above map shows the number of speakers and non-speakers in the Nov 08 Conference. The speakers are highlighted in dark blue and non- speakers are in light blue. Majority of the speakers are from organizations that are within 5-10 miles from T/MC.( Click on the map above for enlarged view)

Finally the last map shows a combination of May 08 and Nov 08 conference. In this map the organizations are divided into three categories: 1) attended May 08 conference 2) attended Nov 08 conference and 3) attended both May 08 & Nov 08 conference. In this map we can see that majority of the local organizations have participated in both the conferences. On the other hand there is less number of repeat participation from regional (outside Chicago) organizations. It can be interpreted from the map that more number of regional organizations were present at May 08 conference as compared to Nov 08 Conference. Thus, it can be concluded that efforts should be made to preserve and increase the growth of attendees and makes sure that there are less number of dropouts. 

Wednesday, September 15, 2010

SNA Analysis of Tutor/Mentor Conference May 2008

Tutor/Mentor Connection organizes biannual Tutor/Mentor Networking and Leadership Conferences for the improvement of quality and availability of tutor/mentor programs in the high poverty areas of Chicago. The main goal of these conferences are to establish connection between the people leading tutor/mentor programs, the people who are volunteers, and the people who provide the money so that high quality tutor/mentor programs can reach to the youth of  high poverty neighborhood.

Every year many organizations participate in these conferences to support the tutor/mentor programs. Leaders of different tutor/mentor programs in Chicago volunteer to present workshops and sit on panels. 

Presented below is a conference map of May 08 Tutor/Mentor conference created by InFlow Social Network Analysis software.


The map provides a geographical distribution of organizations that attended the May 08 conference. It shows different local and regional organizations that participated in the conference. There were about 86 organizations present at the conference, out of which 59 are local organizations and rests are regional organizations. All these organizations work together with a common aim to help youth from high poverty areas to connect with tutors after school hours. The organization names are numbered for the clarity of the map.


The above two maps are divided into two (local organizations and regional organizations) to show a list of organizations that attended the conference. Here we can see that T/MC is connected to more local organizations compared to the regional organizations through the conference.
The above map shows different local organizations connected to T/MC, out of these organizations there are some organizations that provide tutor/mentor programs and there are other organizations which indirectly contribute to tutor/mentor programs by attending conferences, giving presentations, contributing in panel discussions and providing funds. The local organizations, which presented in the conference, are highlighted in pink.
Finally, the above map provides the same analysis described in the previous section for the regional organizations that attended the conference. But here we have also highlighted a donor in green. Karina Ayala-Bermejo, Executive Director, SunTimes Judge Marovitz, Lawyers Lend-A-Hand to Youth Program,  (http://www.lawyerslendahand.org) provided funding to T/MC and also was a speaker for the May 08 conference. It can be interpreted from the map that more donors are required to keep these programs running and improving the quality of tutor/mentor programs.


I am interested to create another version of this map showing the relationship between the organizations that attended the May 08 conference for that we have to create surveys for the people who attended the conference. We can judge the strength of the relationship between these organizations from the survey reports.  By creating this map we can show how different organizations get connected to each other through T/MC conferences. This will attract more leaders, volunteers and donors to the T/MC conference.